
We’re in a dreaded sideways market. Drifting without drama, except that I can hear the faint hiss of a leak as the Slow & Steady portfolio deflates 0.33% this quarter.
If it wasn’t for having to write this update, I admit I’d be executing Operation See-No-Evil. Not even looking at the market for months, maybe years, until this glum period passes.
Passive investing is the name of the game – and it does not encourage actively urging on your portfolio from the sidelines like Ted Lasso shouting impotently at his struggling team.
Still, check-in I must.
Almost inevitably we can see it is government bonds – and property – that are holding us back this quarter:
The Slow & Steady portfolio is Monevator’s model passive investing portfolio. It was set up at the start of 2011 with £3,000. An extra £1,200 is invested every quarter into a diversified set of index funds, tilted towards equities. You can read the origin story and find all the previous passive portfolio posts tucked away in the Monevator vaults.
The Slow & Steady’s overall return after almost 13-years is 5.9% annualised. Let’s call that 3% after inflation.
Respectable, but I can’t help but wonder how many of us won’t go absolutely loopy if our portfolios continue to spin their wheels for the next several years.
How likely is that? How long will we have to wait for the gloom to lift?
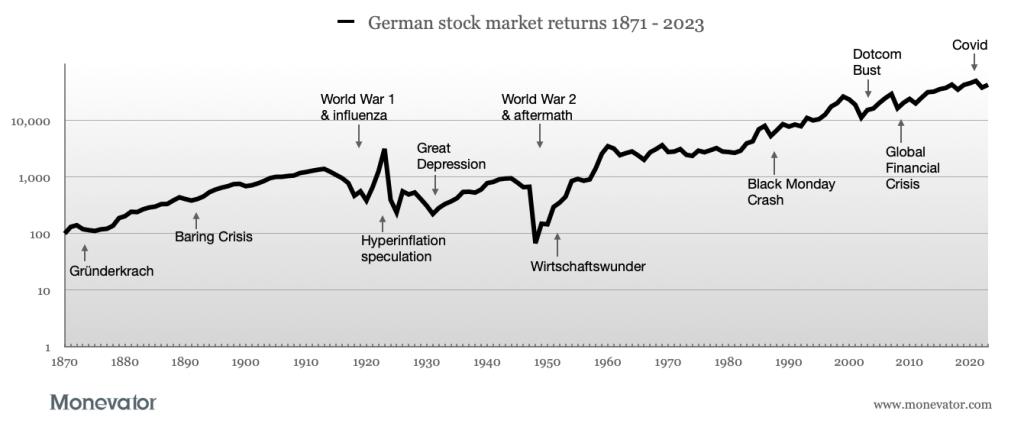
Let’s see how many lost decades UK investors have endured down the years.
Lost decades
Most people’s investing fate will be dominated by their equities, not bonds. And the good news is there are few decades when stocks actually go backwards. The even better news is that the follow-on decade is often spectacular.
The table below shows the lost decades that beset World equities, the rebound that followed, plus the year the portfolio turned positive again. (See the ‘Back in the black’ column).
Note: returns are real annualised total returns. In other words, they show the average annual return (accounting for gains and losses), are inflation-adjusted, and include the impact of dividends.
World equities: lost decades since 1970
World equities have suffered two lost decades in the past half century:
Lost decade
Ann return (%)
+10 years (%)
Back in the black
1970-79
-5.8
11.1
1984
1999-2008
-0.9
8.5
2009
Data from MSCI, compiled by Monevator
The stagflationary ’70s were not an era for checking your stocks six times a day. Six times in the entire decade would have been too much.
But look at the 11% annualised return over the next ten years! That’s more than double the historical average of 5%. If you avoided self-destruction during the wilderness years then you were richly rewarded during the go-go 1980s.
Quite a few Monevator readers will have made their investing debuts during the next lost decade, which followed the Dotcom mania of the late ’90s. I remember colleagues frothing down the pub about their newfound riches and how “the Internet has changed everything”.
It had and it felt like it was raining money.
Then the rains failed.
Looking back the annualised returns from 1999 to 2008 weren’t dreadful. The Noughties were a decent decade. But they were spit-roasted by the Dotcom Bust and the Global Financial Crisis (GFC).
Thankfully confidence was restored by a V-shaped recovery from 2009. The 8.5% annualised returns scooped up over the next ten years helped establish DIY investing as online platforms proliferated.
It may be a tougher sell now though, as a portion of those gains were probably borrowed from the future via high valuations. Such frothiness may have to be paid for by several mediocre years to come.
UK equities: lost decades since 1825
Even the UK market – an Eyeore in recent times among the global bourses – has endured only four lost decades in two centuries:
Lost decade
Ann return (%)
+10 years (%)
Back in the black
1907-16
-0.2
4.1
1924
1943-52
-0.06
12.4
1953
1965-74
-5.4
7.8
1975
1999-2008
-0.7
6.5
2009
Data from Rule Britannia,1 JST Macrohistory2 and FTSE Russell, compiled by Monevator
UK equities didn’t suffer a single lost decade from 1825 to 1907. Those really were the good old days.
Even with the first entry in our table, 1907 to 1914 was actually a raging bull market until World War One derailed everything.
The following ten years were sub-par, but not terrible when you consider the Spanish Flu pandemic that killed millions and the economic depression that settled across Britain and the rest of Europe.
World War 2 is a real eye-opener, given the scale of real-world destruction. The market recovered quickly as post-war inflation dissipated. Returns from 1953 to 1962 are the best of those following the entries in our Lost Decade tables.
Take heart
So don’t feel despondent dear reader. Clearly things have been much worse for some of our investing forebears. We’re far from lost decade territory right now.
In truth, lost decades are not that common, but long stretches of down years are. They’re not a sign that anything is broken. They may well herald that the best years in your particular investing lifetime are yet to come.
Looking at stock market returns through this lens reminds me investing is a long-term game – and that it can feel even longer!
It can take many years of grinding before we enjoy the hoped-for rewards.
New transactions
Every quarter we blow £1,200 onto the market dice and hope to roll a six. Our stake is split between seven funds according to our predetermined asset allocation.
We rebalance using Larry Swedroe’s 5/25 rule. That hasn’t been activated this quarter, so the trades play out like this:
UK equity
Vanguard FTSE UK All-Share Index Trust – OCF 0.06%
Fund identifier: GB00B3X7QG63
New purchase: £60
Buy 0.246 units @ £244.28
Target allocation: 5%
Developed world ex-UK equities
Vanguard FTSE Developed World ex-UK Equity Index Fund – OCF 0.14%
Fund identifier: GB00B59G4Q73
New purchase: £444
Buy 0.804 units @ £552.29
Target allocation: 37%
Global small cap equities
Vanguard Global Small-Cap Index Fund – OCF 0.29%
Fund identifier: IE00B3X1NT05
New purchase: £60
Buy 0.158 units @ £378.69
Target allocation: 5%
Emerging market equities
iShares Emerging Markets Equity Index Fund D – OCF 0.21%
Fund identifier: GB00B84DY642
New purchase: £96
Buy 54.201 units @ £1.77
Target allocation: 8%
Global property
iShares Environment & Low Carbon Tilt Real Estate Index Fund – OCF 0.17%
Fund identifier: GB00B5BFJG71
New purchase: £60
Buy 28
29.241 units @ £2.05
Target allocation: 5%
UK gilts
Vanguard UK Government Bond Index – OCF 0.12%
Fund identifier: IE00B1S75374
New purchase: £324
Buy 2.603 units @ £124.46
Target allocation: 27%
Royal London Short Duration Global Index-Linked Fund – OCF 0.27%
Fund identifier: GB00BD050F05
New purchase: £156
Buy 150.87 units @ £1.03
Target allocation: 13%
New investment contribution = £1,200
Trading cost = £0
Take a look at our broker comparison table for your best investment account options. InvestEngine is currently cheapest if you’re happy to invest only in ETFs. Or learn more about choosing the cheapest stocks and shares ISA for your circumstances.
Average portfolio OCF = 0.16%
If this all seems too complicated check out our best multi-asset fund picks. These include all-in-one diversified portfolios, such as the Vanguard LifeStrategy funds.
Interested in tracking your own portfolio or using the Slow & Steady investment tracking spreadsheet? Our piece on portfolio tracking shows you how.
Finally, learn more about why we think most people are better off choosing passive vs active investing.
Take it steady,
The Accumulator
Acheson G, Hickson CR, Turner JD & Ye Q (2009) Rule Britannia! British Stock market returns, 1825-1870.Òscar Jordà, Katharina Knoll, Dmitry Kuvshinov, Moritz Schularick, and Alan M. Taylor. 2019. “The Rate of Return on Everything, 1870–2015.” Quarterly Journal of Economics, 134(3), 1225-1298.
The post The Slow and Steady passive portfolio update: Q3 2023 appeared first on Monevator.
