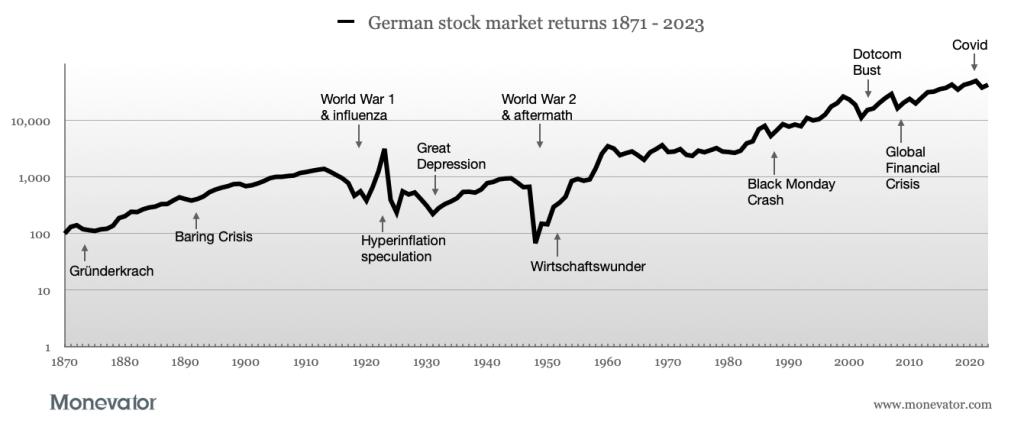
This past year has not been pretty for investors. Indeed it’s the worst on record for our Slow and Steady passive portfolio – even after a slight bounce back from last quarter.
We’ve taken a -13% loss during benighted 2022. Our previous all-time bruising was a mere -3% knuckle-scrape from 2018.
In fact we’ve only had three down years since the portfolio began in 2011. Six years ended with double-digit gains!
So while most of us understand that all good runs come to an end, I do worry we could still be mentally unprepared for a sustained spell of negativity.
Mental as anything
How many of us got used to glancing at our portfolio for a quick ego boost during the good times?
Gains dancing before our eyes and seemingly rearranging themselves into the words: “You’re doing brilliantly, old chum. Keep it up!”
How will we now fare when incessantly poor numbers decrypt into the sub-text: “You’re going nowhere, ya loser!”
We know all the powerful mantras to recite to ward off devilry:
“Investing is a long-term game.”“Buy low, sell high.”Be greedy when others are fearful.”
And anyone who’s read their financial history appreciates a key test is keeping your head when the markets play rough.
But can we keep the faith?
Down but never out
While we sit on our hands and wait for the good times to return, here’s the latest numbers from the Slow and Steady portfolio in 8K Drama-O-Vision:
The Slow & Steady portfolio is Monevator’s model passive investing portfolio. It was set up at the start of 2011 with £3,000. An extra £1,200 is invested every quarter into a diversified set of index funds, tilted towards equities. You can read the origin story and find all the previous passive portfolio posts tucked away in the Monevator vaults.
The investing Razzie for 2022 has to go to UK government bonds. Our gilt fund lost 38% after inflation1, comfortably surpassing the previous historic low of -33% in 1916.2
We’re truly on the horns of a dilemma with bonds.
If inflation isn’t suppressed and bond yields climb vertically then even worse could follow. UK gilts suffered real-terms losses of -68.5% from 1915 to 1920.
But before you reach for the ‘bond eject’ button, know that gilt disaster was followed by a spectacular 480% rebound from 1921 to 1934.
Sack off bonds after a bad year and you can miss some big rallies:
1920: -19.7%1921: 27.4%
1974: -27.2%1975: 10.9%
1981: -1.6%1982: 42%
1994: -12.2%1995: 14.5%
2013: -8.5%2014: 13.9%
Inflation-adjusted real returns. Data for UK gilt nominal returns from the JST Macrohistory database.3
Bonds spook many investors because they’re esoteric. But the fact is – like equities – bonds have bouncebackability.4
Dump your bonds now for cash and you may crystallise a loss that currently only exists on paper…
…or you may save yourself more pain, if it turns out we’re in for a rerun of the 1970s.
Given the uncertainty, I wouldn’t blame you for reducing bond exposure. But I respectfully suggest you avoid ‘all or nothing’ reactions such as swearing off bonds for life.
The long view
After a year like 2022, it’s probably better to count our blessings over a longer timeframe.
Stepping back we can see the portfolio has made a nominal annualised return of:
1.6% over 3 years. (Miserable!)3.3% over 5 years. (Pants!)6.3% over 12 years. (Actually, I’ll take it!)
That’s around 3.3% annualised in real returns. Historically we might expect an average 4% annualised from a 60/40 portfolio.
So while we’re currently sub-average, it’ll have to do for now.
One year ago that same number was a rollicking 9.8%. Things can change quickly.
Building back better?
Our property fund’s -25% real-terms annual loss was peak awful on the equity side of the Passive Portfolio’s scorecard.
Curse you rising interest rates!
And how do corporates deal with bad news? They rebrand it.
Coincidentally, iShares decided it was high time our dilapidated old global property tracker got a new lick of green, eco-conscious paint.
On 24 November, the fund changed its name from this:
iShares Global Property Securities Equity Index Fund
To this:
iShares Environment & Low Carbon Tilt Real Estate Index Fund
Despite some confusion on iShares’ website, it’s also changing the fund’s index from this:
FTSE EPRA/NAREIT Developed Index
To this:
FTSE EPRA/NAREIT Developed Green Low Carbon Target Index
The gist is that the vanilla property tracker now has an Environmental, Social, and Governance (ESG) twist.
The new index apparently screens out companies that deal in weaponry, tobacco, and fossil fuels.
It also excludes – or at least takes a dim view of – anyone into human rights abuses, child labour, slavery, organised crime… that sort of thing.
Finally, it up-weights those constituents whose property holdings are deemed sustainable. That means they have to make an effort to be energy efficient and to obtain ‘green building certification’.
It all sounds excellent in principle – I doubt many of us want to prop up the share prices of slum landlords running slave gangs.
But just how radical a change is this in practice?
I must admit I’m not over familiar with the micro-details of the FTSE EPRA/NAREIT Developed Index.
Still, I’ve found one commentary about the switch from a firm of financial advisors called Old Mill, which says:
An initial look at the proposals suggest there will be little change in the underlying investments of the fund, with 23 of the approximately 340 investable companies being excluded.
And my own eyeballing of the respective index factsheets reveals:
A reshuffle of the Top 10 holdings into slightly different percentage weights. Rejigged sub-sectors.Industrial, retail, and healthcare REITs are down 1-2% in the green index. Office and residential REITS are up 1-2%.
Call me Graham Thunberg but this doesn’t smack of saving the planet.
Meanwhile, the five year annualised returns (the longest available) published for the two indices reveal:
0.5% a year for the green index 1.5% a year for the standard index
While I admire people who want to invest in line with their values (assuming they’re not massive fans of cluster bombs and extortion) I’m personally dubious about the ESG label.
The potential for greenwashing is enormous. And I despair about my chances of verifying the ethical claims given:
The finance industry is adept at misdirection We’ve been gaslighted about climate change for more than 30 years
There’s also a danger of individuals ticking the ESG boxes and then forgetting about taking direct action like:
Cutting back on planes and meat Trading in a gas-guzzler for an electric car Turning down the thermostat Voting for the political party with the best green policies
Still, as a card-carrying passive investor I’m inclined to keep our holding as is.
What say thee?
The one reason I’d consider switching to a new property fund is because the Slow and Steady portfolio is meant to be demonstrative for our readers.
Hence our property allocation is supposed to test the benefit – or otherwise – of diversifying into global real estate.
All this ESG gilding muddies the picture. I’d rather create an ESG version of the portfolio to illustrate the trials and tribulations of socially responsible investing.
That’s my opinion – but I’d really like to know what you think.
Should passive fund managers switch their index trackers to green indices?
Should I swap this fund for one focused purely on commercial property as an asset class?
Would you like us to come up with an ESG passive portfolio? That way we can contrast the fortunes of saint and sinner stocks alike.
Please let me know in the comments below.
Annual rebalancing time
I’ll run quickly through the annual portfolio maintenance because this post is already loooong.
We previously committed to an asset allocation shift of 2% per year from conventional gilts to index-linked bonds until we have a 50-50 split between them.
That means:
The Vanguard UK Government Bond index fund decreases to a 27% target allocationThe Royal London Short Duration Global Index Linked (GBP hedged) fund increases to a 13% target allocation
Our overall allocation to equities and bonds remains static at 60/40.
We also annually rebalance our positions back to their preset asset allocations at this point in the year. After 2022 that means selling off a portion of our badly performing equities and buying into battered bonds.
It’s a counterintuitive move (as discussed above). But over the long-term rising bond yields mean gilts are now better value than they were.
Inflation adjustments
To maintain our purchasing power, we must also increase our regular investment contributions every year by inflation.
We use the RPI rate. It has ballooned 14% this year according to the Office for National Statistics. (CPI was 10.7%).
So we’ll invest £1,200 per quarter in 2023. That’s up from £1,055 in 2022 and a titchy £750 back when we started in 2011.
New transactions
Our £1,200 contribution is split between our seven funds according to our predetermined asset allocation. The trades play out like this:
UK equity
Vanguard FTSE UK All-Share Index Trust – OCF 0.06%
Fund identifier: GB00B3X7QG63
Rebalancing sale: £457.14
Sell 1.951 units @ £234.35
Target allocation: 5%
Developed world ex-UK equities
Vanguard FTSE Developed World ex-UK Equity Index Fund – OCF 0.14%
Fund identifier: GB00B59G4Q73
Rebalancing sale: £984.72
Sell 1.958 units @ £502.91
Target allocation: 37%
Global small cap equities
Vanguard Global Small-Cap Index Fund – OCF 0.29%
Fund identifier: IE00B3X1NT05
Rebalancing sale: £124.68
Sell 0.334 units @ £372.79
Target allocation: 5%
Emerging market equities
iShares Emerging Markets Equity Index Fund D – OCF 0.2%
Fund identifier: GB00B84DY642
Rebalancing sale: £280.10
Sell 156.435 units @ £1.79
Target allocation: 8%
Global property
iShares Environment & Low Carbon Tilt Real Estate Index Fund – OCF 0.17%
Fund identifier: GB00B5BFJG71
New purchase: £134.76
Buy 60.596 units @ £2.22
Target allocation: 5%
UK gilts
Vanguard UK Government Bond Index – OCF 0.12%
Fund identifier: IE00B1S75374
New purchase: £1957.69
Buy 14.781 units @ £132.45
Target allocation: 27%
Royal London Short Duration Global Index-Linked Fund – OCF 0.27%
Fund identifier: GB00BD050F05
New purchase: £954.18
Buy 921.911 units @ £1.04
Dividends reinvested: £203.38 (Buy another 196.502 units)
Target allocation: 13%
New investment contribution = £1,200
Trading cost = £0
Take a look at our broker comparison table for your best investment account options. InvestEngine is currently cheapest if you’re happy to invest only in ETFs. Or learn more about choosing the cheapest stocks and shares ISA for your circumstances.
Average portfolio OCF = 0.16%
If it all seems too complicated check out our best multi-asset fund picks. These include all-in-one diversified portfolios such as the Vanguard LifeStrategy funds.
Interested in tracking your own portfolio or using the Slow & Steady investment tracking spreadsheet? Our piece on portfolio tracking shows you how.
Finally, find out why we think most people are better off choosing passive vs active investing.
Take it steady,
The Accumulator
-27% in nominal terms with CPI inflation at 10.7%.See the JST Macrohistory database, which documents UK gilt returns since 1871.Òscar Jordà, Katharina Knoll, Dmitry Kuvshinov, Moritz Schularick, and Alan M. Taylor. 2019. “The Rate of Return on Everything, 1870–2015.” Quarterly Journal of Economics, 134(3), 1225-1298.The riskier, longer maturities do anyway. Short-term bonds more closely resemble cash.
The post The Slow and Steady passive portfolio update: Q4 2022 appeared first on Monevator.


